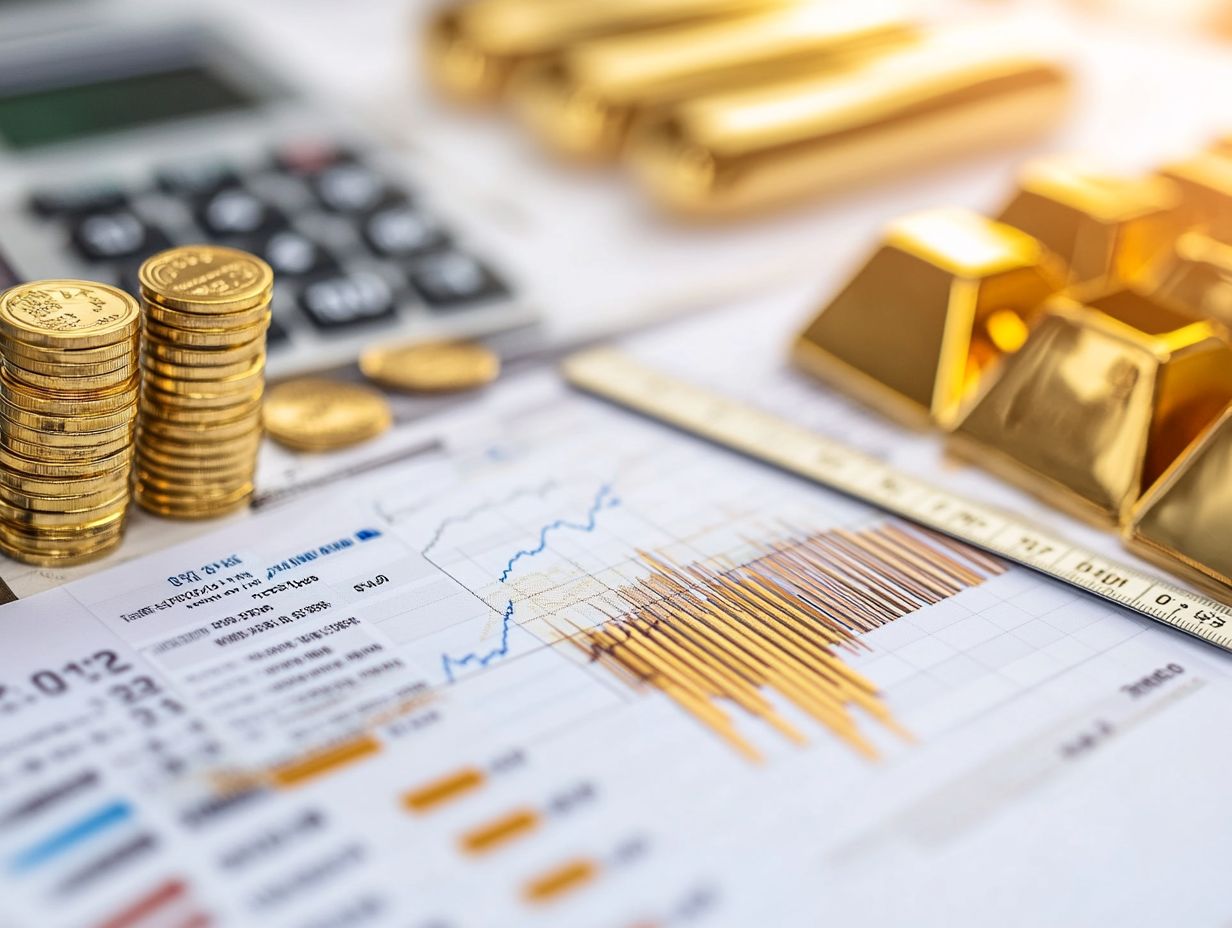
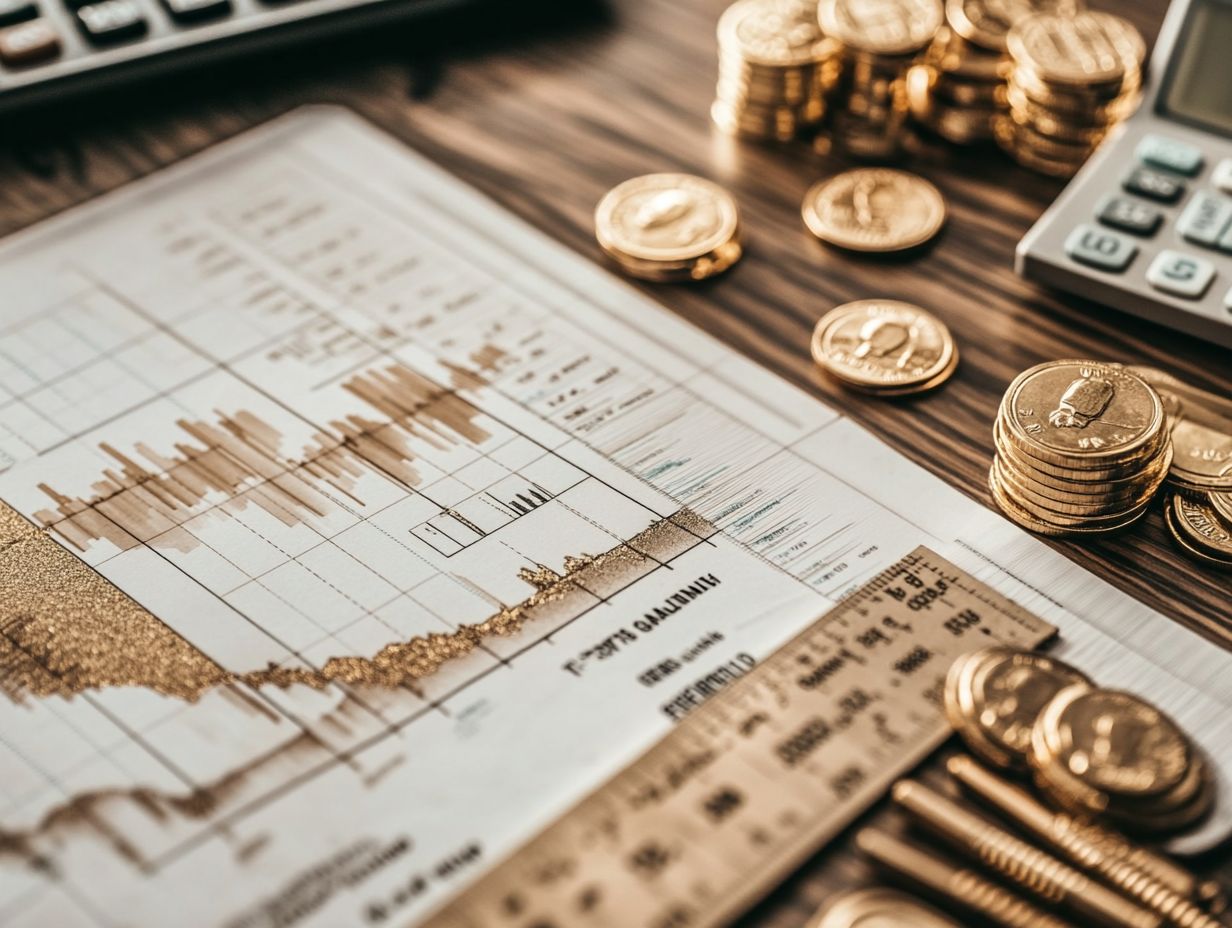
Leveraging Technical Analysis for Precious Metals

In the realm of investing, grasping market trends is essential for making informed decisions, particularly when it comes to precious metals.

Dive into the essentials of technical analysis to unlock your trading potential! This article covers key concepts, important indicators like moving averages and support levels, and practical tips to enhance your trading strategies.
Whether you re a seasoned trader or just starting out, this guide empowers you to harness the power of technical analysis for improved investment outcomes.
Contents
- Key Takeaways:
- Key Indicators for Precious Metals
- Interpreting Technical Analysis for Precious Metals
- Tips for Applying Technical Analysis to Precious Metals
- Frequently Asked Questions
- What is Technical Analysis and how is it used to leverage precious metals?
- What are some common technical indicators used for analyzing precious metals?
- How can Technical Analysis help investors make informed decisions about precious metals?
- What are the risks associated with using Technical Analysis for precious metals?
- Can Technical Analysis be used for short-term and long-term trading of precious metals?
- Are there any resources available for learning more about leveraging Technical Analysis for precious metals?
Key Takeaways:
- Technical analysis uses past price and volume data to predict future market movements, making it a valuable tool for analyzing precious metals.
- Key indicators, such as moving averages, support and resistance levels, and the relative strength index, help identify trends and facilitate informed decisions when trading precious metals.
- When applying technical analysis to precious metals, consider market conditions and supply and demand while avoiding common mistakes like ignoring fundamental analysis and relying solely on technical indicators.
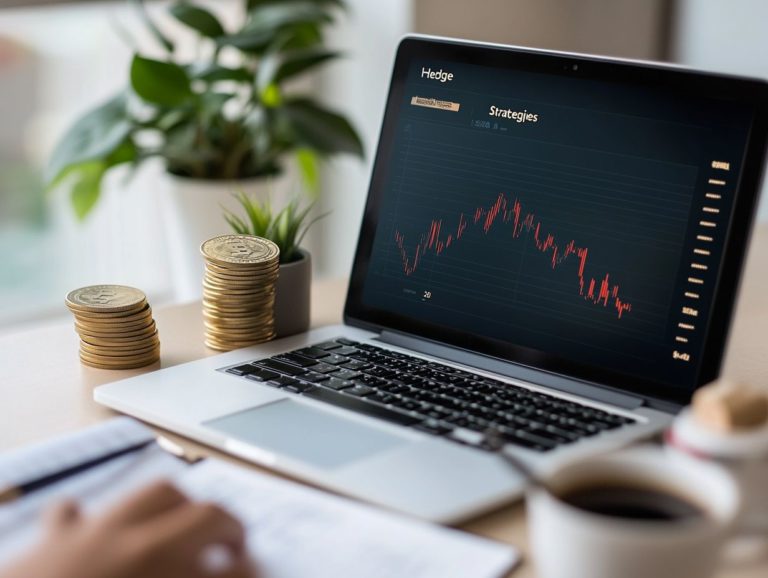
What is Technical Analysis?

Technical analysis is your go-to method for evaluating and forecasting future price movements of financial assets, including precious metals like gold and silver. By diving into historical data and market trends, you can develop a comprehensive understanding of where the market might be headed.
This approach uses tools like trend analysis, trading signals, and indicators to reveal market behavior. It helps you find the best times to buy and sell.
This is especially crucial during times of market volatility and fluctuations in trading volume. With this analytical lens, you can discern whether an asset is on a bullish path, suggesting prices are likely to rise, or a bearish trajectory, indicating potential declines.
For example, many traders rely on moving averages to smooth out price data and reveal trends over time. Influential figures in this field, such as J. Welles Wilder, who developed the Average True Range (ATR) to measure market volatility, and Gerald Appel, the mind behind the MACD (Moving Average Convergence Divergence), have significantly shaped trading approaches.

These indicators enable you to make decisions grounded in historical price movements, offering clarity on the optimal moments to buy or sell across various market conditions.
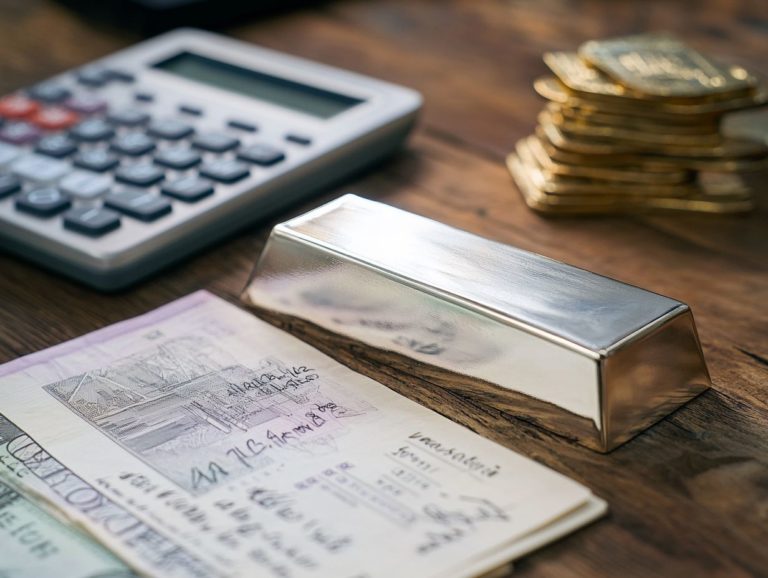
Why Use Technical Analysis for Precious Metals?
Utilizing technical analysis for precious metals like gold and silver enables you to make well-informed decisions. By examining market trends and historical data, you enhance your risk management strategies. By grasping price fluctuations and leveraging trend analysis tools, you can pinpoint potential entry and exit points, effectively maneuvering through market volatility.
This analytical approach lets you observe patterns and indicators that signal market movements. It provides valuable insights into future price behavior, allowing you to craft a robust investment strategy that adapts to shifting market conditions while minimizing potential losses. For in-depth information, check out the top resources for precious metals research.
Technical analysis also aids in identifying overbought or oversold conditions. This enables you to take advantage of price reversals or continuations. For a deeper understanding, you can explore how to analyze precious metals market trends. Such strategic agility boosts the likelihood of successful trades and fosters greater confidence in your investment journey.
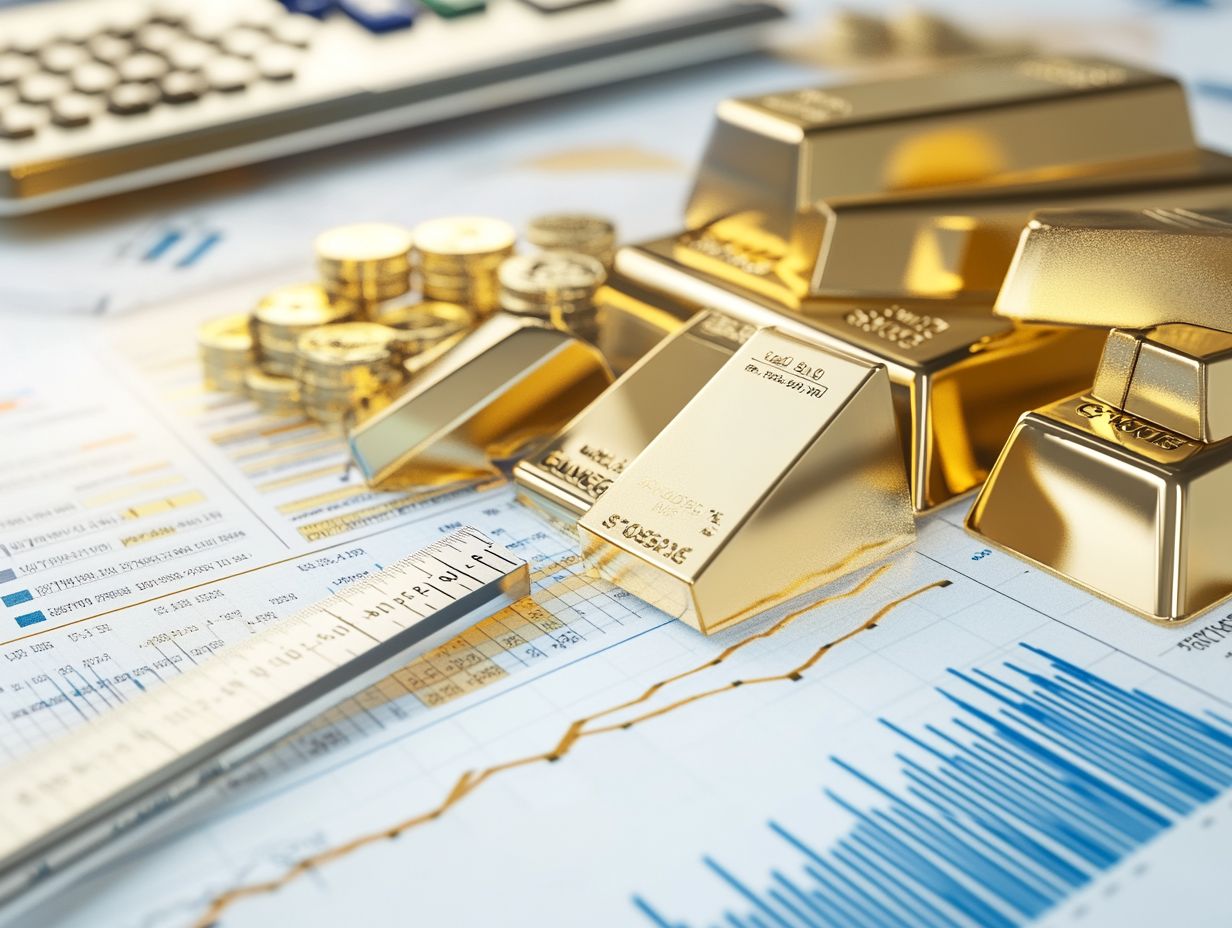
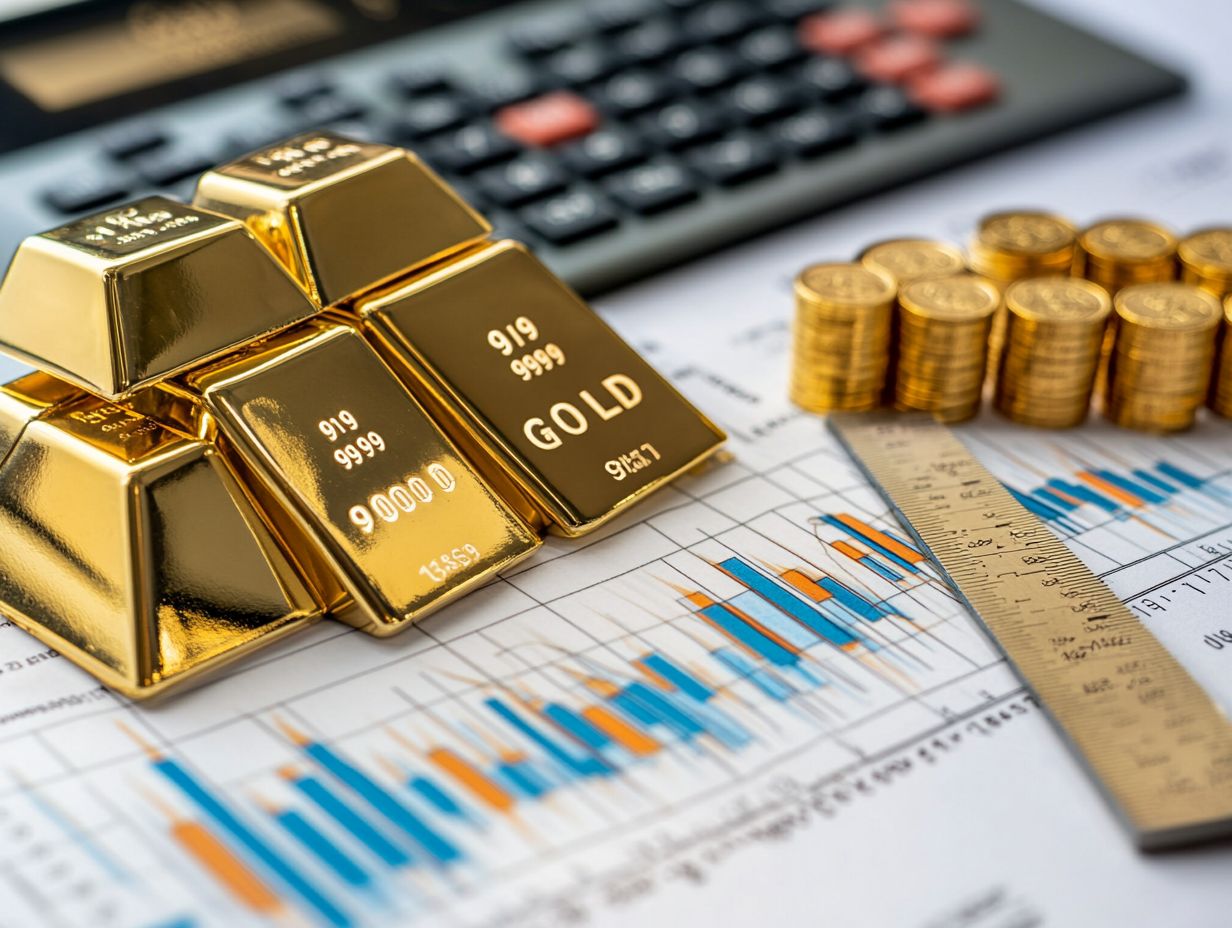
Key Indicators for Precious Metals
Key indicators serve as invaluable tools in technical analysis. They offer critical insights into the performance of precious metals like gold and silver. With indicators such as moving averages, Fibonacci ratios, and Bollinger Bands at your disposal, you can effectively pinpoint support and resistance levels, analyze market trends, and refine your investment strategies.

These tools help confirm price movements and identify potential trading signals, ultimately enhancing your decision-making process in the market.
Ready to apply what you’ve learned? Start utilizing these insights today to improve your trading outcomes!
Moving Averages
Moving averages, which help smooth price data, are essential tools in price analysis. They skillfully smooth out the price fluctuations of precious metals to unveil underlying trends. By examining simple moving averages (SMA) and exponential moving averages (EMA), you can effortlessly pinpoint bullish or bearish trends, identify key price levels, and make well-informed decisions about your entry and exit points.
These averages are calculated by averaging a specific time period. For example, a 20-day SMA sums the closing prices of the last 20 days and divides that total by 20. In contrast, an EMA places greater emphasis on recent prices, rendering it more responsive to new information.

Traders often utilize the crossover of these averages as pivotal signals. When the 50-day EMA crosses above the 200-day SMA, it may suggest a lucrative long position. Conversely, the opposite crossover could indicate a strategic sell.
Using these techniques can empower you to make winning trading decisions based on the current market landscape.
Support and Resistance Levels
Support and resistance levels are vital elements in price analysis, serving as key barriers that shape price movements in the market. By identifying these levels, you can develop effective trading strategies. They highlight potential price reversals and indicate where market sentiment may shift between bullish and bearish trends.
To pinpoint support levels, look for historical price points where assets have consistently bounced back. For instance, if gold has repeatedly found a safety net at $1,800 per ounce, that becomes a focal point for many traders seeking opportunities, especially when considering the 5 essential indicators for precious metals.

Resistance levels emerge where prices have struggled to climb higher, acting like a ceiling that hinders further gains. If silver has encountered resistance at $25 multiple times, traders can expect a shift or consolidation around this level.
By grasping these dynamics, you enable yourself to make informed decisions that align with market psychology. This approach enhances your potential for profit while helping you minimize risk.
Relative Strength Index (RSI)
The Relative Strength Index (RSI) serves as a pivotal momentum indicator in price analysis. It allows you to assess the speed and change of price movements in precious metals. By examining RSI levels, you can pinpoint overbought or oversold conditions, enabling you to make informed decisions about when to enter or exit the market amid shifting sentiment.
Calculated over a 14-day period, the RSI ranges from 0 to 100. Readings above 70 suggest overbought conditions, while those below 30 indicate oversold situations. This range is essential as it helps you interpret price trends and potential reversals effectively. A rising RSI may confirm an ongoing uptrend; a declining RSI could hint at an impending downtrend.

Divergences between price action and the RSI can signal potential price corrections. This makes it a critical tool for anyone actively trading in the realm of precious metals.
Interpreting Technical Analysis for Precious Metals
Interpreting technical analysis for precious metals is a crucial skill for traders. It helps navigate the intricate landscape of market sentiment and effectively validate trends.
By integrating a variety of indicators and analytical techniques, you can uncover deeper insights into trading signals. This enables you to make informed investment decisions and optimize your profits in the dynamic world of precious metals trading.
Ready to take your trading to the next level? Dive into the world of precious metals with these insights!
Understanding Trends and Patterns
Understanding trends and patterns in the realm of precious metals is crucial for you as a trader looking to take advantage of price changes. By identifying bullish and bearish trends, along with specific price patterns, you can make well-informed decisions that enhance your trading strategies and elevate your investment portfolio.

For example, when you spot a bullish trend defined by higher highs and higher lows, you might decide to enter long positions (buying with the hope of selling at a higher price), anticipating that prices will keep climbing. If you recognize a bearish trend characterized by lower highs and lower lows, it may prompt you to consider short positions (selling borrowed assets to buy back at a lower price) or protective measures to safeguard against potential losses.
Identifying patterns like head and shoulders can signal potential reversals. Flags often indicate a continuation of the current trend. These insights enable you to navigate the intricate landscape of precious metals effectively, optimizing your entry and exit points. For more detailed information, check out the 5 best resources for precious metals analysis to maximize your trading success.
Using Indicators to Make Informed Decisions
Utilizing indicators effectively is crucial for you to make informed decisions when trading precious metals. By combining various technical indicators, you can generate reliable trading signals that guide your investment strategy and enhance your ability to navigate market volatility.
This approach enables you to gain valuable insights into potential price movements and market trends. For example, employing moving averages can help you identify the overall direction of the market. The Relative Strength Index (RSI) offers clarity on whether an asset is overbought or oversold. Additionally, exploring 5 silver investment resources can aid you in assessing price volatility and pinpointing potential breakout points.
By weaving these tools together, you can confirm specific entry and exit points, ultimately refining your strategies and maximizing your profits. For those interested in investing, understanding the best resources for learning about precious metals can enhance your decision-making.
Tips for Applying Technical Analysis to Precious Metals
Applying technical analysis to precious metals demands a strategic approach that harmonizes your market knowledge with effective trading practices.
By adopting sound trading strategies and robust risk management techniques, you can seize market trends and steer clear of common pitfalls that might threaten your investment portfolio.
Factors to Consider
You must consider several key factors to succeed!
- Market volatility: Be prepared for erratic price swings.
- Trading volume: A surge in volume often signals strong interest or a potential breakout. Act quickly!
- Critical price levels: Identifying support and resistance levels can guide your decisions on when to enter or exit positions.
Adapting to changing market conditions might require you to implement risk management techniques, such as setting stop-loss orders or diversifying your portfolio, allowing you to minimize potential losses while seizing lucrative opportunities.
In conclusion, mastering technical analysis in precious metals trading involves understanding trends, utilizing indicators, and applying strategic techniques. To further enhance your knowledge, check out these resources for tracking gold investment trends. Stay alert and ready to act on the insights gathered to enhance your trading success!
Common Mistakes to Avoid
Avoiding common mistakes in technical analysis can significantly elevate your success in the precious metals market. By recognizing pitfalls like depending too much on one indicator, neglecting risk management, and overlooking essential trading signals, you can refine your investment strategy and make more informed decisions.
It s easy to fall into the trap of fixating on one type of indicator, such as moving averages. This one-dimensional approach can cause you to miss critical market nuances that could inform your trading decisions.
Ignoring solid risk management strategies can lead to substantial losses, especially if you take on excessive leverage without a safety net. Dismissing vital trading signals, like volume and price patterns, can lead to missed opportunities that could have been lucrative, particularly for those looking at essential resources for palladium investors.
To mitigate these risks, it’s essential for you to adopt a diversified approach. Utilize multiple indicators and maintain strict risk guidelines to significantly enhance your effectiveness in the dynamic landscape of precious metals trading.
Frequently Asked Questions
What is Technical Analysis and how is it used to leverage precious metals?
Technical Analysis is a method of analyzing asset prices and market trends by studying historical data, primarily through the use of charts. It is used to make informed decisions on when to buy, sell, or hold precious metals based on patterns and indicators.
What are some common technical indicators used for analyzing precious metals?
Some common technical indicators include moving averages, the relative strength index (RSI), which measures price momentum, and Bollinger Bands, which show price volatility. These indicators can help identify potential entry and exit points for trading.
How can Technical Analysis help investors make informed decisions about precious metals?
Technical Analysis can help investors make informed decisions by providing a visual representation of market trends and potential price movements. By analyzing past patterns and indicators, investors can gain insights into future price movements and make more educated decisions.
What are the risks associated with using Technical Analysis for precious metals?
Like any investment strategy, risks are associated with using Technical Analysis for precious metals. It is not a foolproof method and can provide false signals, leading to potential losses. Conducting thorough research is crucial for your trading success!
Can Technical Analysis be used for short-term and long-term trading of precious metals?
Yes, Technical Analysis can be used for both short-term and long-term trading. Short-term traders may use shorter time frames and more frequent analysis, while long-term traders may use longer time frames and less frequent analysis to make their decisions.
Are there any resources available for learning more about leveraging Technical Analysis for precious metals?
Yes, plenty of resources are available, including books, online courses, and webinars, to help investors learn more about leveraging Technical Analysis for precious metals. It is essential to continuously educate oneself and stay updated on the latest market trends and indicators.
For more insights, start exploring these resources today and take your trading skills to the next level!